How to Choose the Appropriate Control Chart Type?
Proper selection of control charts is essential to obtain the benefits of statistical process control (CEP, SPC).
Many factors must be considered when choosing a control chart:
- The type of data being graphed (continuous/variable/dimensional or attribute/visual/go no-go).
- The required sensitivity (difference of the change to be detected).
- If the chart includes data from multiple sources.
- The ease and cost of sampling.
- Production volumes.
For variables, X-Bar and R (or X-Bar and S) charts are very common, however, there are cases where they are not appropriate. For example, charts for multiple locations within the subgroup are used when a subgroup consists of measurements that may come from different distributions. Examples include:
- Multiple measurements in the same unit (e.g. diameter in 3 places).
- Units produced during the same cycle from different cavities, machining locations, filling heads, etc.
When sampling is costly, within-sample variation is negligible, or when detection of “small” changes in the process is unnecessary, plots of individual measurements are often used. EWMA and CUSUM charts are useful when plotting individual measurements, but traditional Individuals/Moving Range charts do not provide adequate sensitivity (ability to detect process changes when they occur).
The appropriate control charts and their application are described below:
Variable
X-Bar & S:
- Monitoring: Allows you to monitor the process average and standard deviation
- Application: Large volumes, unique feature, sample size greater than or equal to 2
X-Bar & R:
- Monitoring: Allows you to monitor the process average and range
- Application: Large volumes, unique feature, sample size between 2 and 5
X-Bar & MR:
- Monitoring: Allows you to monitor the process average and moving range
Application: No sensitivity needed, sampling is expensive, long production cycles (note: normality of data must be considered)
Deviation from Nominal:
- Monitoring: Allows you to monitor the process average and range (or standard deviation)
- Application: Small production runs (multiple products). All products have similar standard deviation
X-Bar & S Standardized:
- Monitoring: Allows you to monitor the process average and standard deviation
- Application: The standard deviation of each product is different
X-Bar & R Standardized:
- Monitoring: Allows you to monitor the process average and range
- Application: Small production runs (multiple products)
X-Bar, Rb, Rw / X-Bar, Rb, S:
- Monitoring: Allows you to monitor the process average and range (or standard deviation) within the subgroup.
- Application: Measurements of different locations of the product within the subgroup. Variation within the subgroup. Sample averages are not statistically different.
CUSUM:
- Monitoring: Accumulated deviations from the mean
- Application: Individual charts when X and MR do not have the necessary sensitivity
EWMA:
- Monitoring: Weighted moving ranges
- Application: Individual charts when X and MR do not have the necessary sensitivity
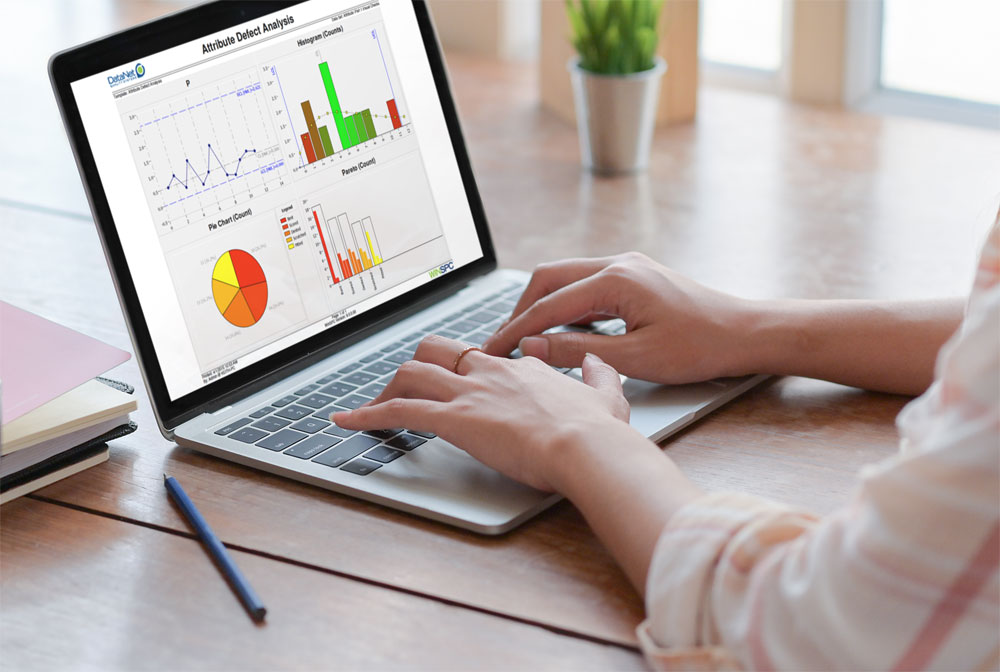
Statistical process control software can provide you with all this information in real time and without the need to perform any calculations. Learn more
Attributes
np:
- Monitoring: Number of defective units
- Application: Pass/fail, Fixed sample size. n > 3/p
p:
- Monitoring: Defect ratio
- Application: Pass/fail, Fixed or variable sample size. n > 3/p
p Standardized:
- Monitoring: Proportion of standardized defects
- Application: Pass/fail, Variable sample size. n > 3/p. Can be used in small production runs
c:
- Monitoring: Number/quantity of defects
- Application: Multiple Types of defects. Fixed sample size. n such that c > 7
u:
- Monitoring: Number/quantity of defects per unit
- Application: Multiple Types of defects. Fixed or variable sample size. n such that c > 7
u Standardized:
- Monitoring: Standardized number/quantity of defects per unit
- Application: Multiple Types of defects. Variable sample size. n such that c > 7. It can be used for small productions

Written by Francisco Olano
Related Posts

Success story: Denso automates quality inspection with WinSPC
DENSO is a global company focused on advanced mobility that positively changes the way the world moves and contributes to well-being. As a global Fortune 500 company, we have a broad product portfolio and global impact.BackgroundDenso is a premier automotive supplier,...

WinSPC version 9.0.14
WinSPC is an advanced software for Statistical Process Control in real time, which allows leading industries in the market to monitor and optimize their production processes, to improve the quality of their products, reduce the variation in processes and increase the...

Success story: Denso automates quality inspection with WinSPC
DENSO is a global company focused on advanced mobility that positively changes the way the world moves and contributes to well-being. As a global Fortune 500 company, we have a broad product portfolio and global impact.BackgroundDenso is a premier automotive supplier,...
Subscribe to the Blog
To stay up to date with all the news and exclusive content


Recent Comments